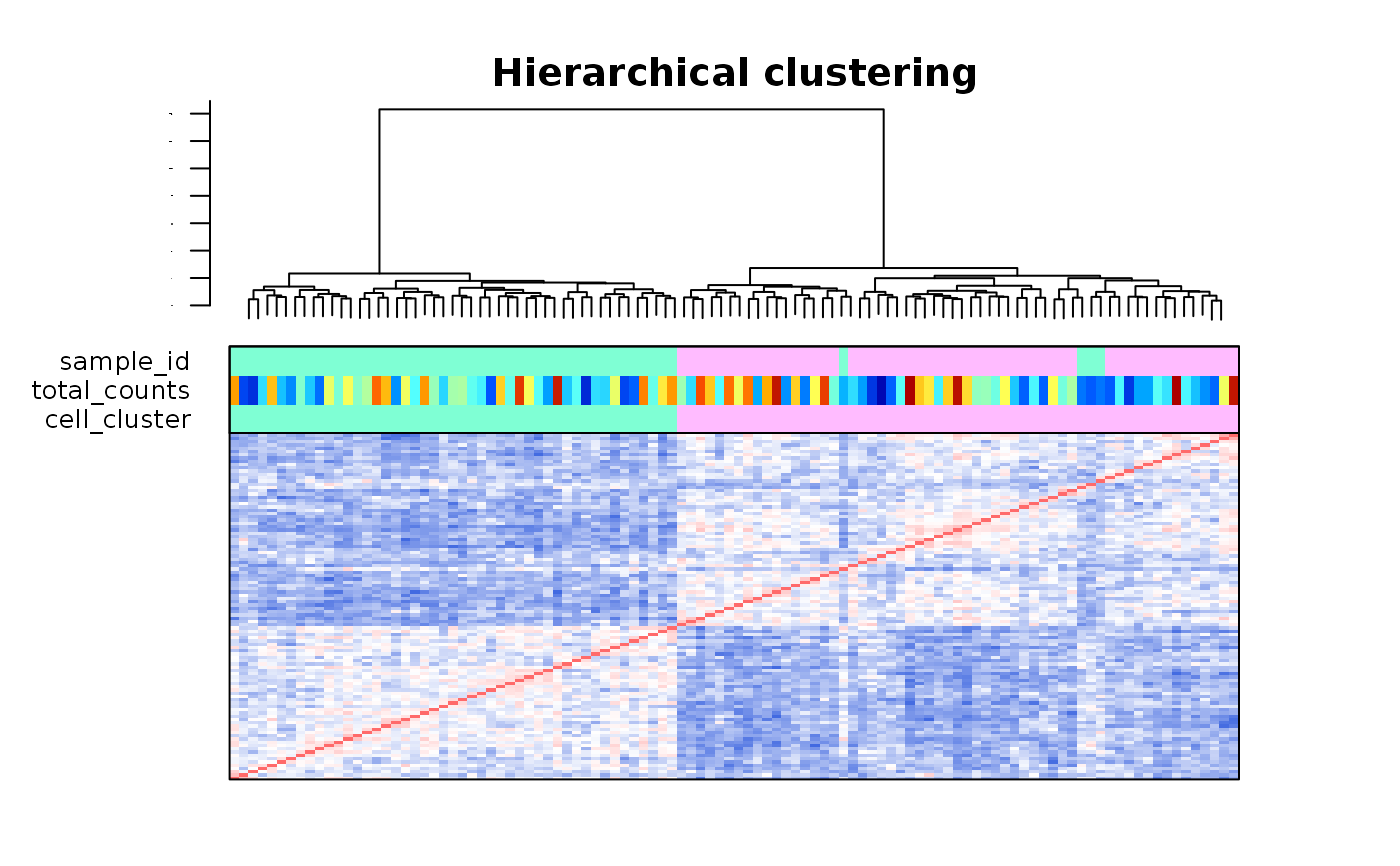
Plot cell correlation heatmap with annotations
plot_heatmap_scExp(
  scExp,
  name_hc = "hc_cor",
  corColors = (grDevices::colorRampPalette(c("royalblue", "white", "indianred1")))(256),
  color_by = NULL,
  downsample = 1000,
  hc_linkage = "ward.D"
)
Arguments
| scExp | A SingleCellExperiment Object |
|---|---|
| name_hc | Name of the hclust contained in the SingleCellExperiment object |
| corColors | A palette of colors for the heatmap |
| color_by | Which features to add as additional bands on top of plot |
| downsample | Number of cells to downsample |
| hc_linkage | A linkage method for hierarchical clustering. See cor. ('ward.D') |
Value
A heatmap of cell to cell correlation, grouping cells by hierarchical clustering.
