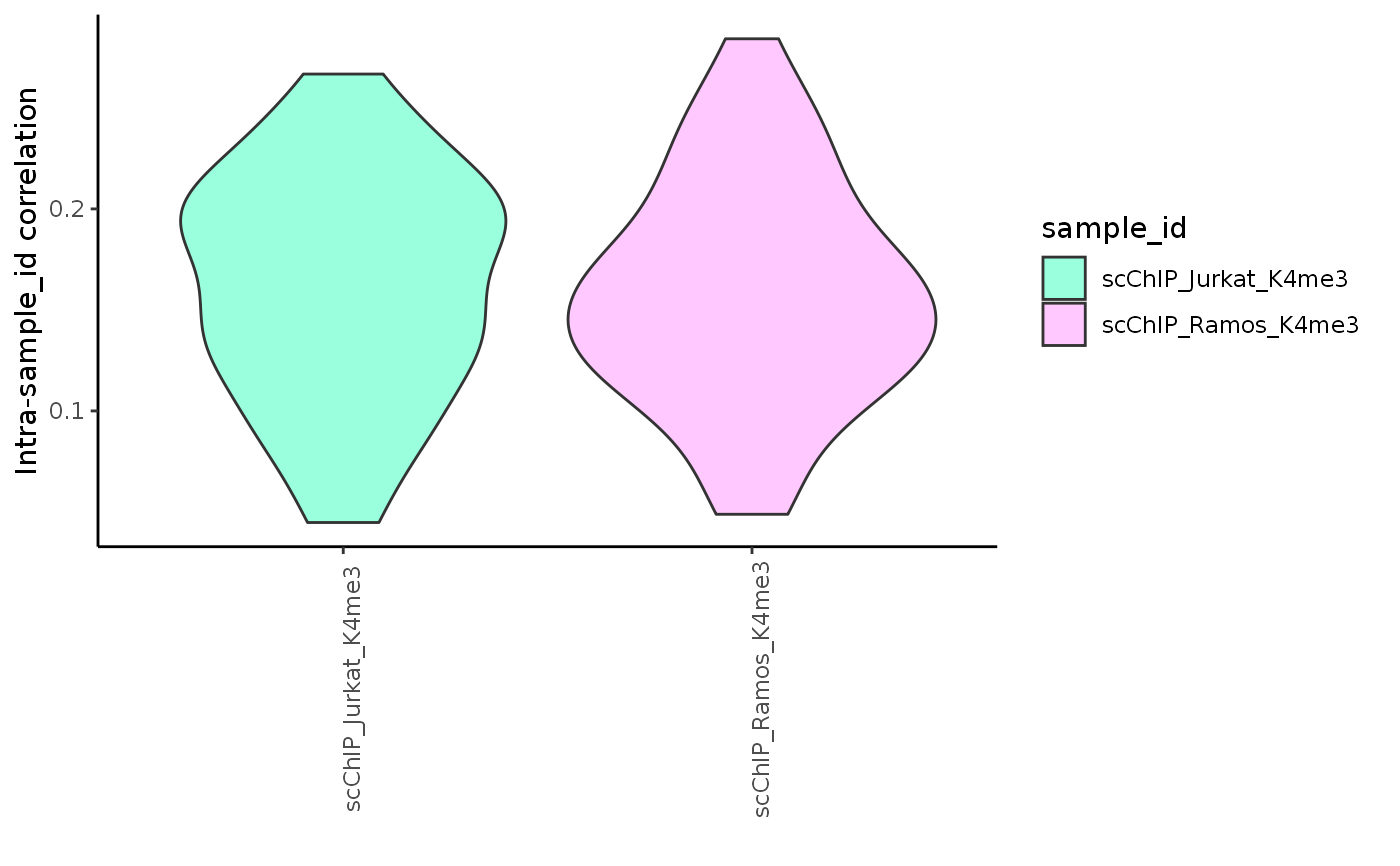
Violin plot of intra-correlation distribution
Source:R/plotting_functions.R
plot_intra_correlation_scExp.RdViolin plot of intra-correlation distribution
plot_intra_correlation_scExp(
  scExp_cf,
  by = c("sample_id", "cell_cluster")[1],
  jitter_by = NULL,
  downsample = 5000
)
Arguments
| scExp_cf | A SingleCellExperiment |
|---|---|
| by | Color by sample_id or cell_cluster |
| jitter_by | Add jitter points of another layer (cell_cluster or sample_id) |
| downsample | Downsample for plotting |
Value
A violin plot of intra-correlation