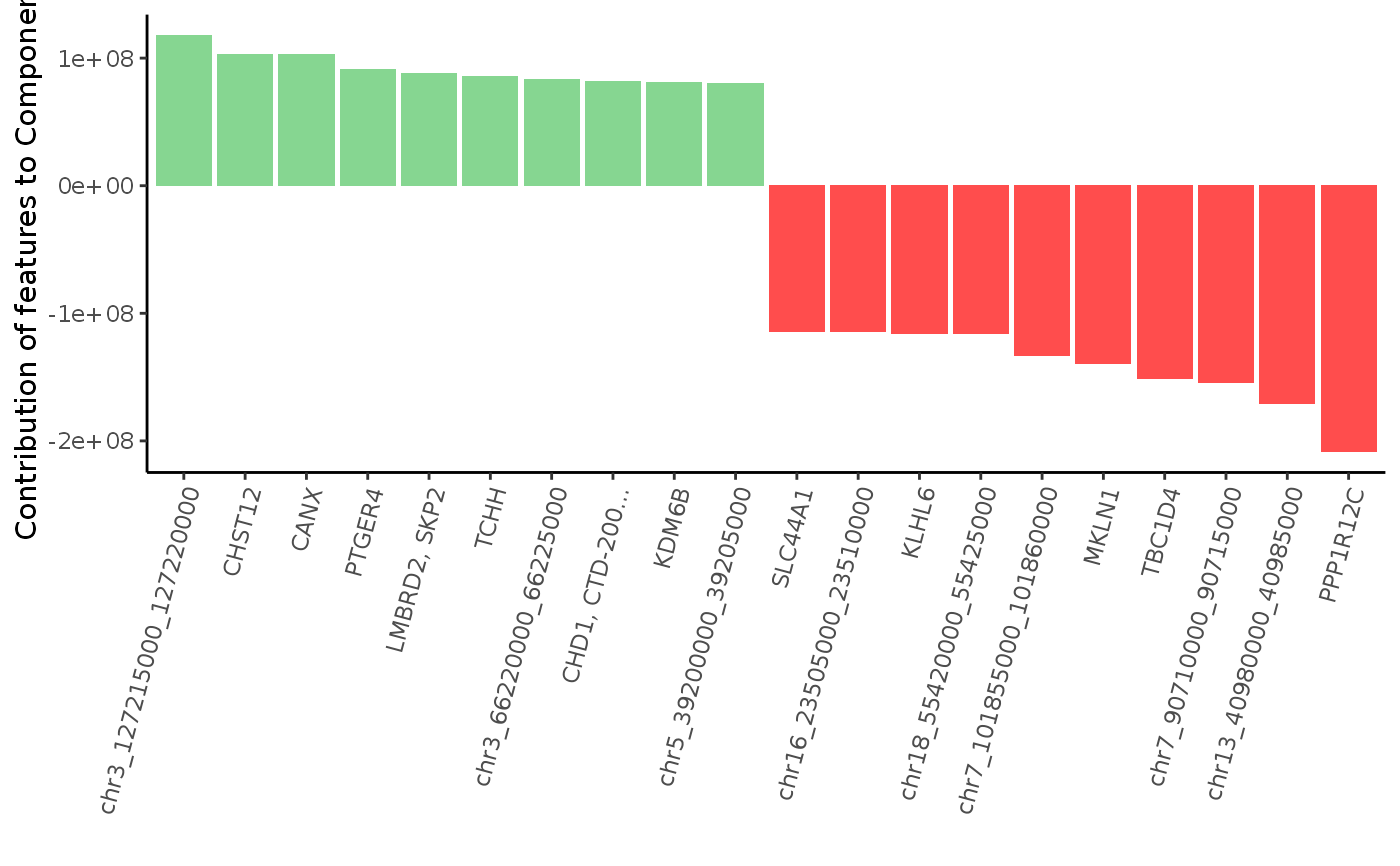
Plot Top/Bottom most contributing features to PCA
Source:R/plotting_functions.R
plot_most_contributing_features.RdPlot Top/Bottom most contributing features to PCA
plot_most_contributing_features(
  scExp,
  component = "Component_1",
  n_top_bot = 10
)
Arguments
| scExp | A SingleCellExperiment containing "PCA" in reducedDims and gene annotation in rowRanges |
|---|---|
| component | The name of the component of interest |
| n_top_bot | An integer number of top and bot regions to plot |
Value
A barplot of top and bottom features with the largest absolute value in the component of interest
Details
If a gene TSS is within 10,000bp of the region, the name of the gene(s) will be displayed instead of the region